
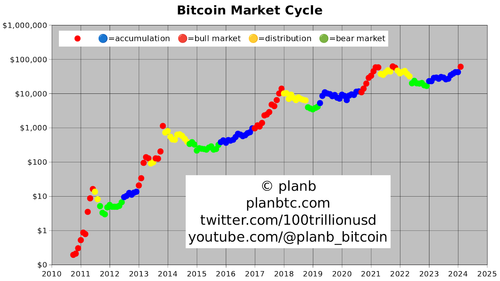
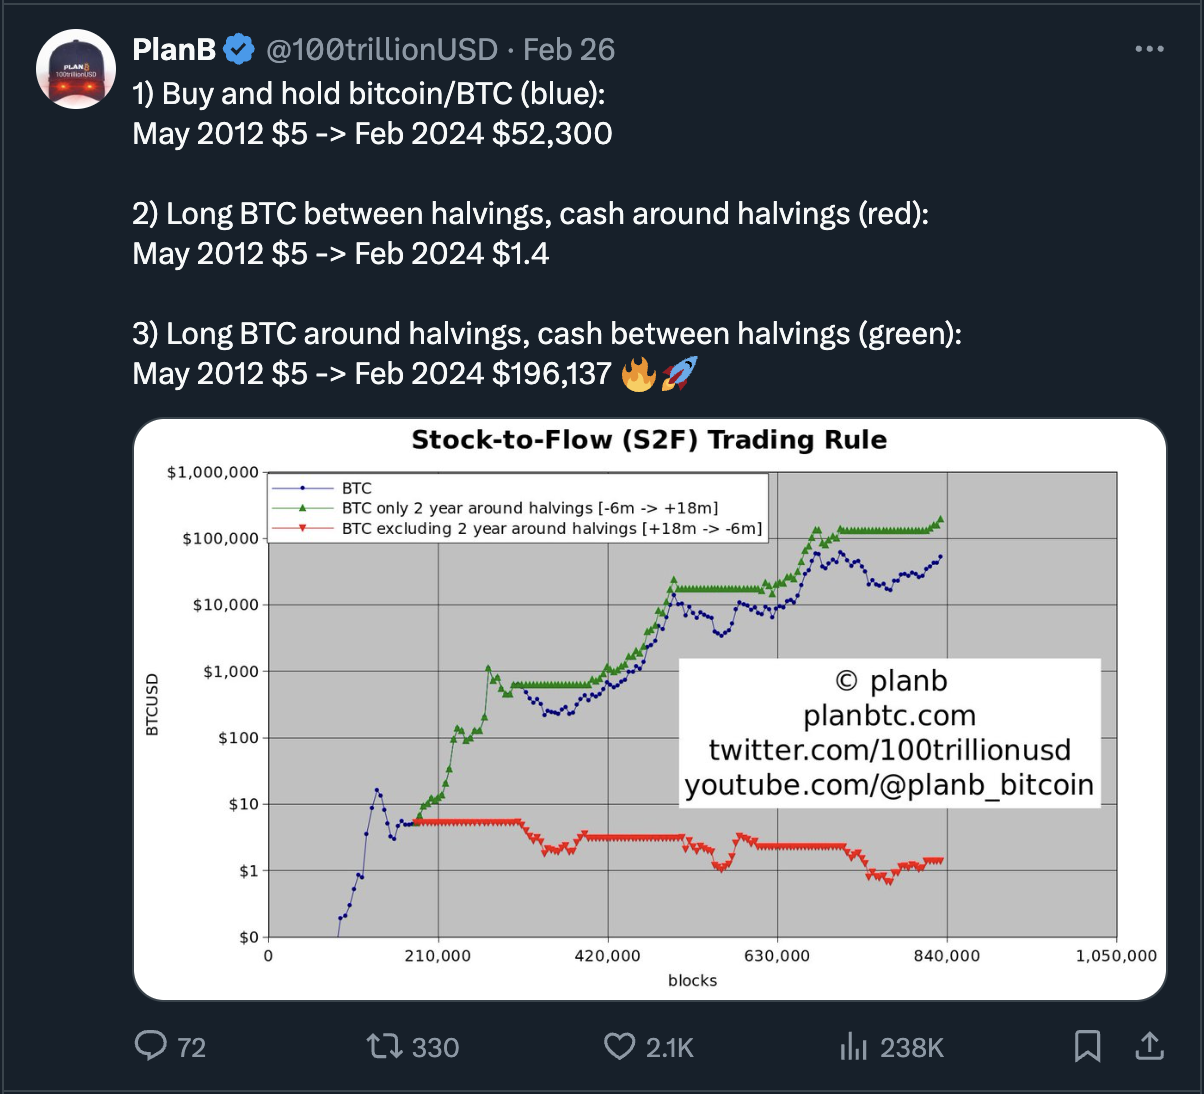
The bull market signal from PlanB’s bull market signal flashed following the biggest-ever (in dollar-term) Bitcoin monthly candle in February, and with the price trading firmly above $62,000. Now, the signal suggests that the accumulation phase may be over, and we may see ‘~10 months of face-melting FOMO.’
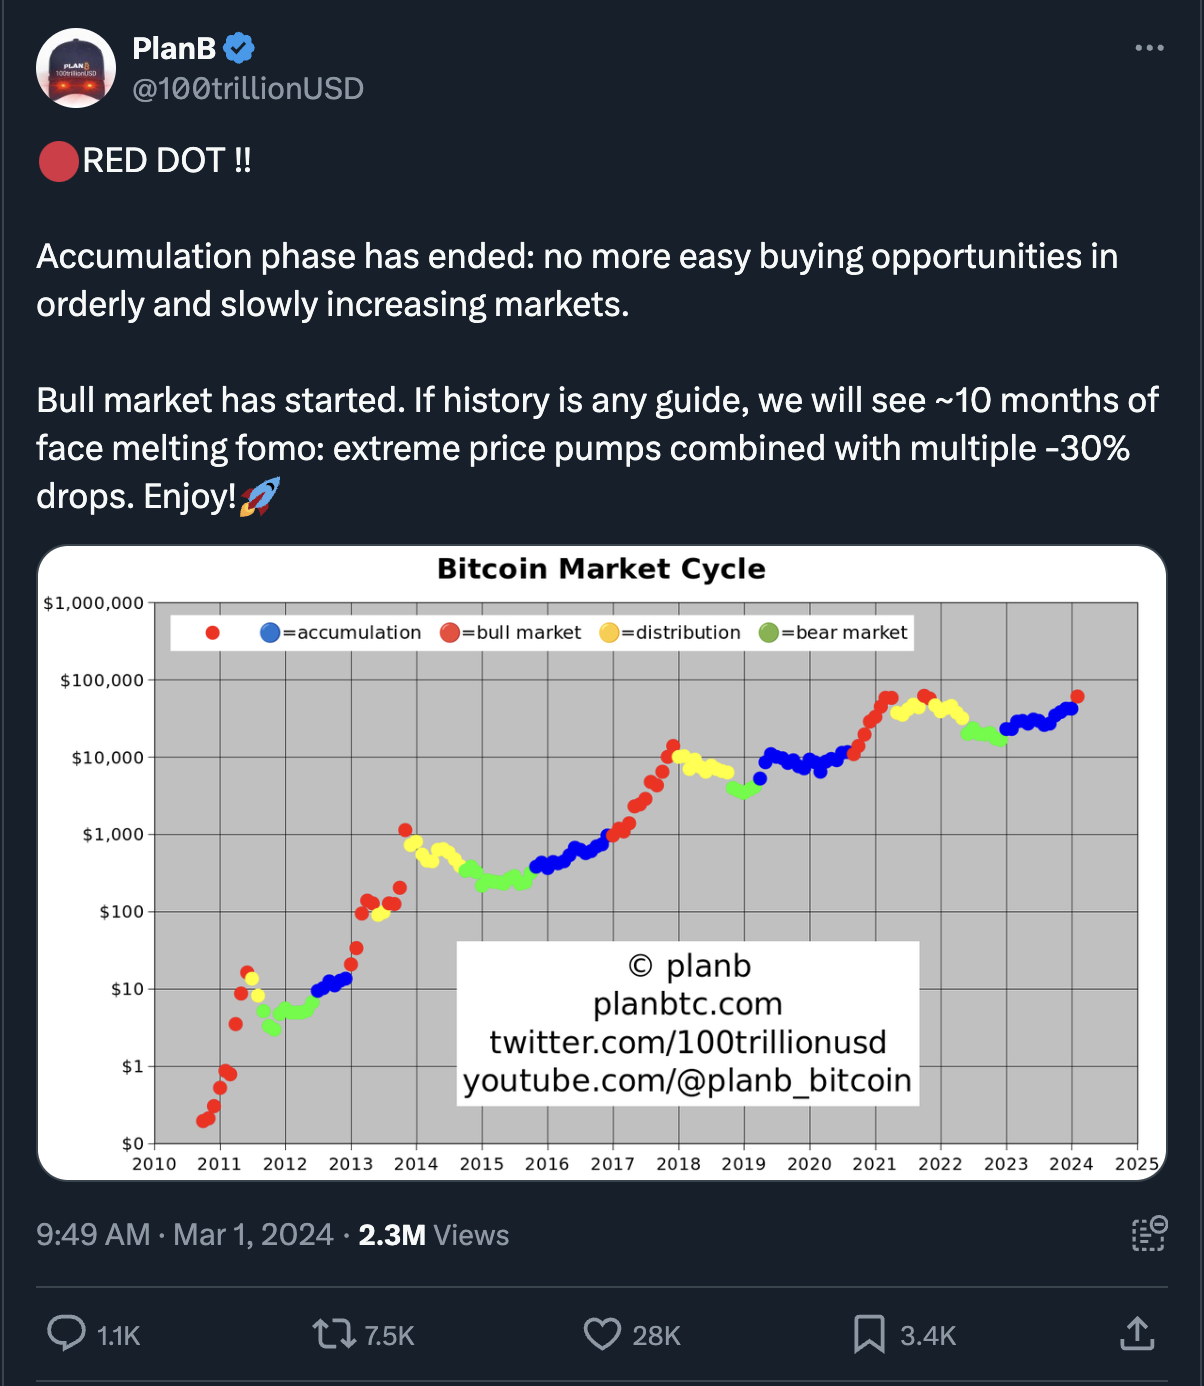
PlanB’s controversial S2F model, viral during the 2021 bull run, has since proven far from a perfect Bitcoin price oracle. Still, it retains a number of supporters who attribute the discrepancy between the model's predictions and the actual market to external factors and anticipate that the price could catch up with the model levels in the new cycle.
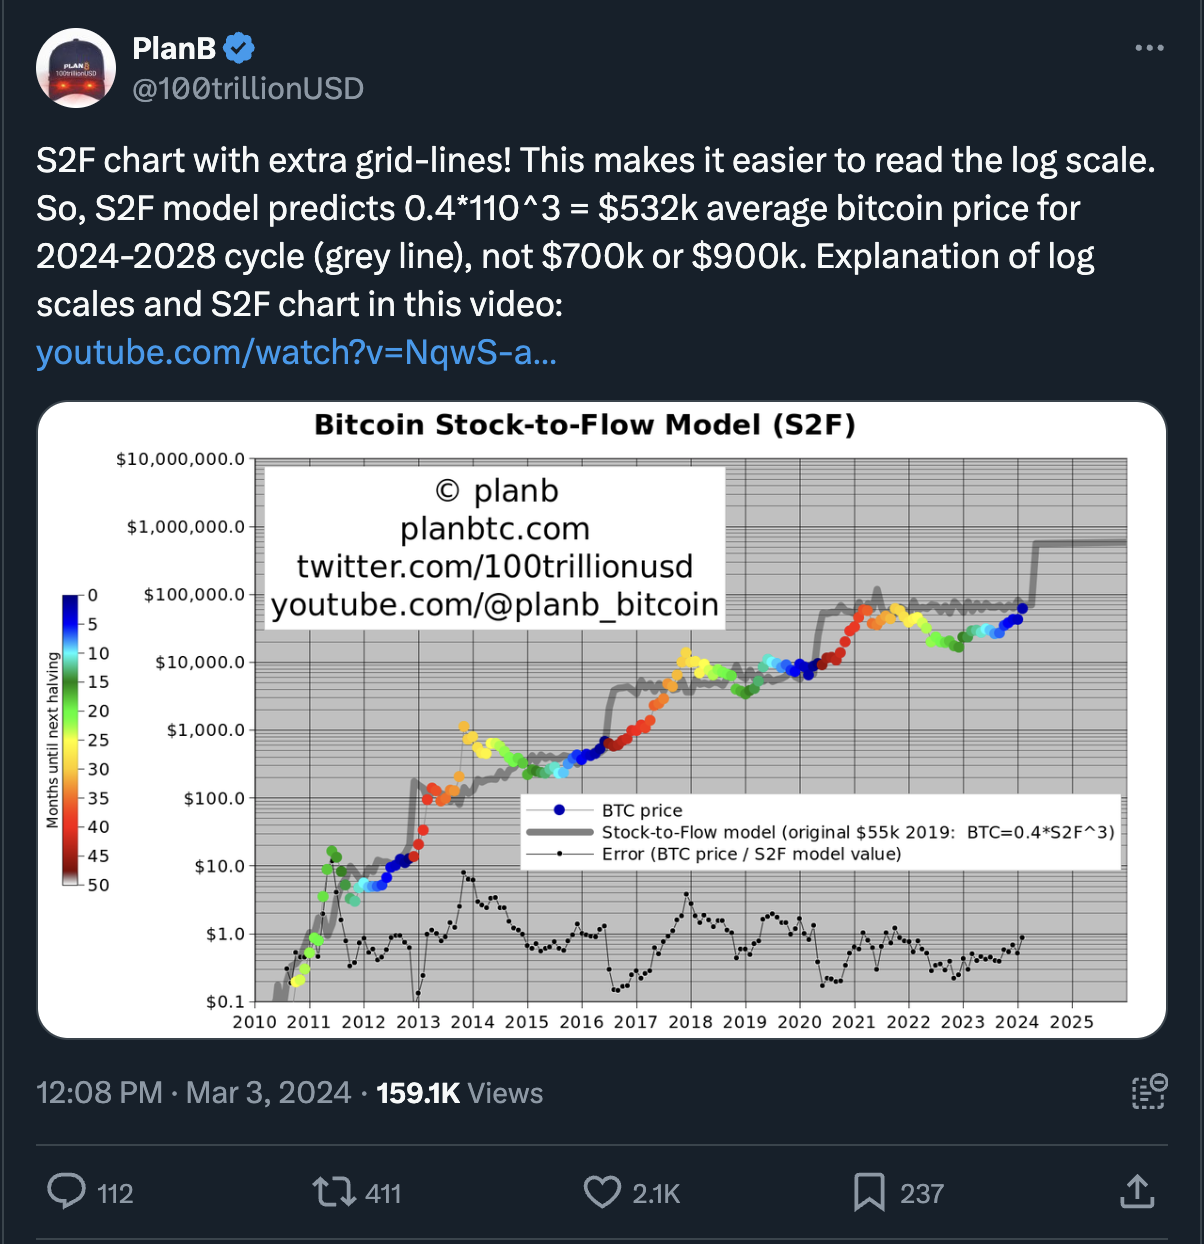
It's worth noting, however, that PlanB’s current predictions align with many other prominent analysts' forecasts. Specifically, Matt Hougan, the CIO at Bitwise, commented in a CNBC interview: “I think there’s an even bigger wave coming in a few months as we start to see the major wirehouses turn on.” He elaborated that so far, the interest in spot Bitcoin ETFs has come primarily from retail investors, hedge funds, and independent financial advisors.
“This has been bitcoin's IPO moment, bitcoin's in a new era period of price discovery, and I think the bitcoin price could go substantially higher from here.” (Matt Hougan for CNBC)
(X post)
In addition to the quotes and analysis discussed last week, another indicator, Williams%R Oscillator, delivered a rare bullish signal with this monthly close. As highlighted by Caleb Franzen, this development suggests that $180,000 per BTC in this cycle has become a much more tangible possibility.
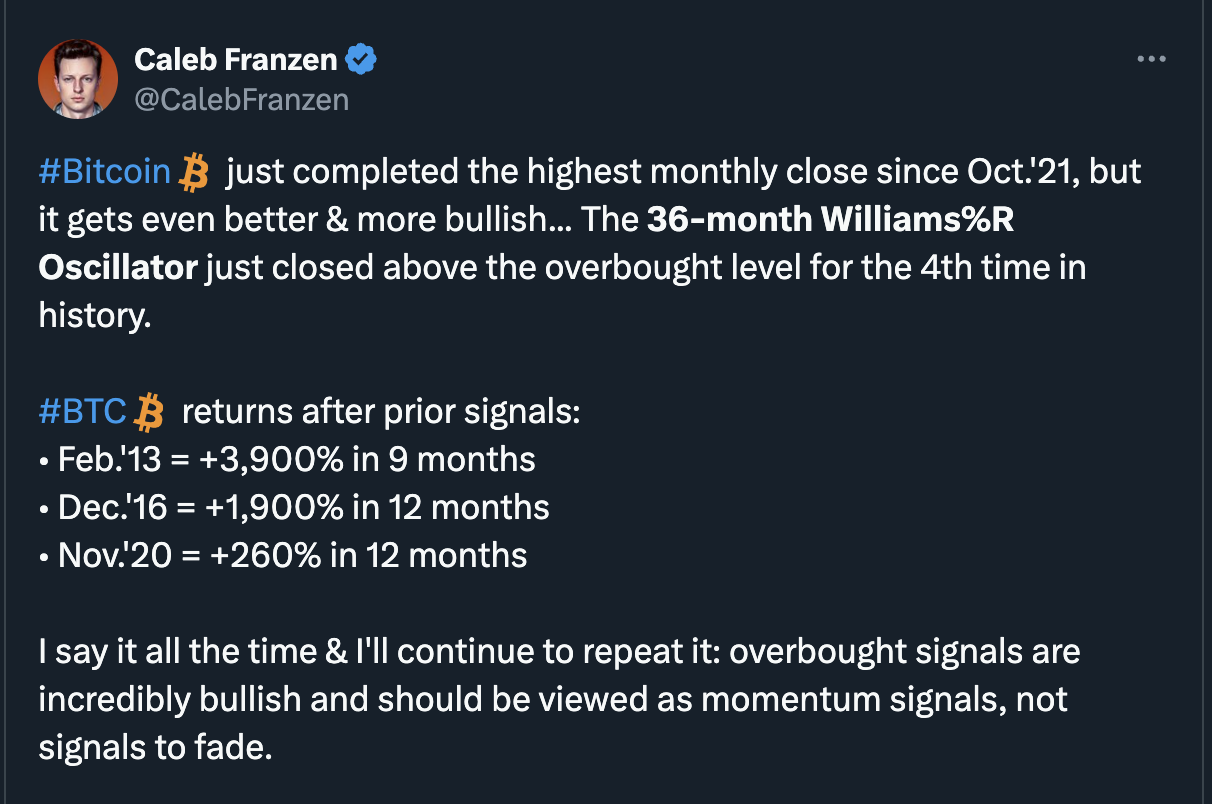
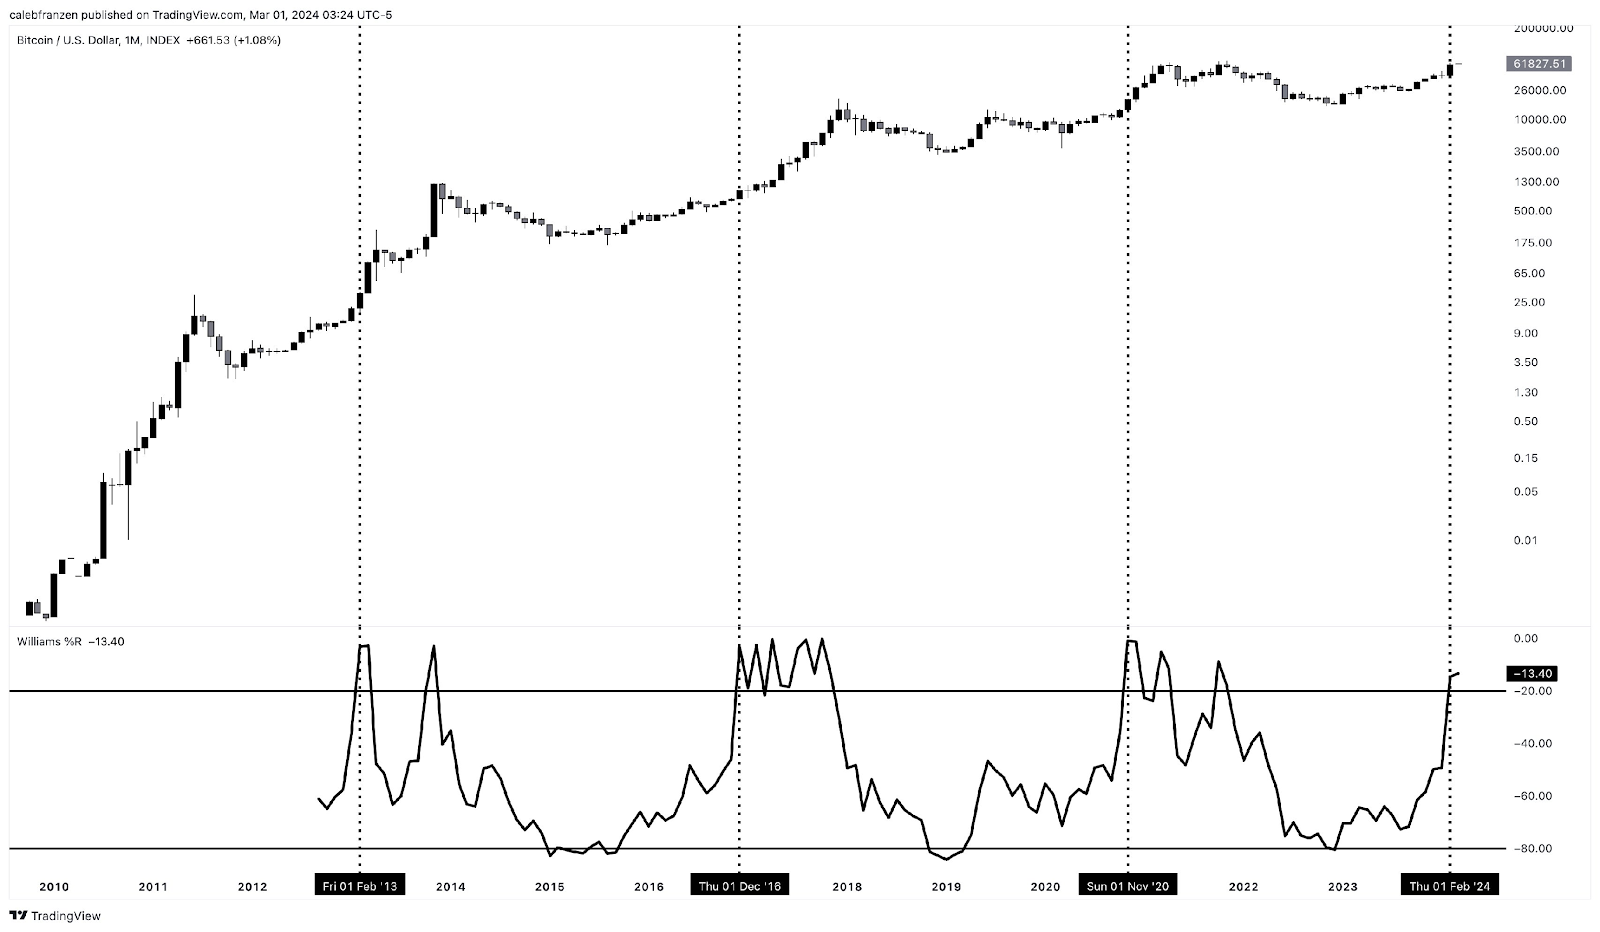
(Source: Caleb Franzen on X)
“If #BTC is going to experience those types of gains again, I can't help but think about how Ethereum $ETH and alts will perform in that environment. The fact of the matter is that bull markets are characterized by two things: (i) ETHBTC rising, (ii) BTC.D falling.” (Caleb Franzen on X)
Talking about Ethereum… It’s ‘about to explode,’ according to Tony “The Bull,” a technical analyst and the Head of Research at NewsBTC, who pointed to the Bollinger Bands (BB) indicator expanding after a historically tight squeeze.
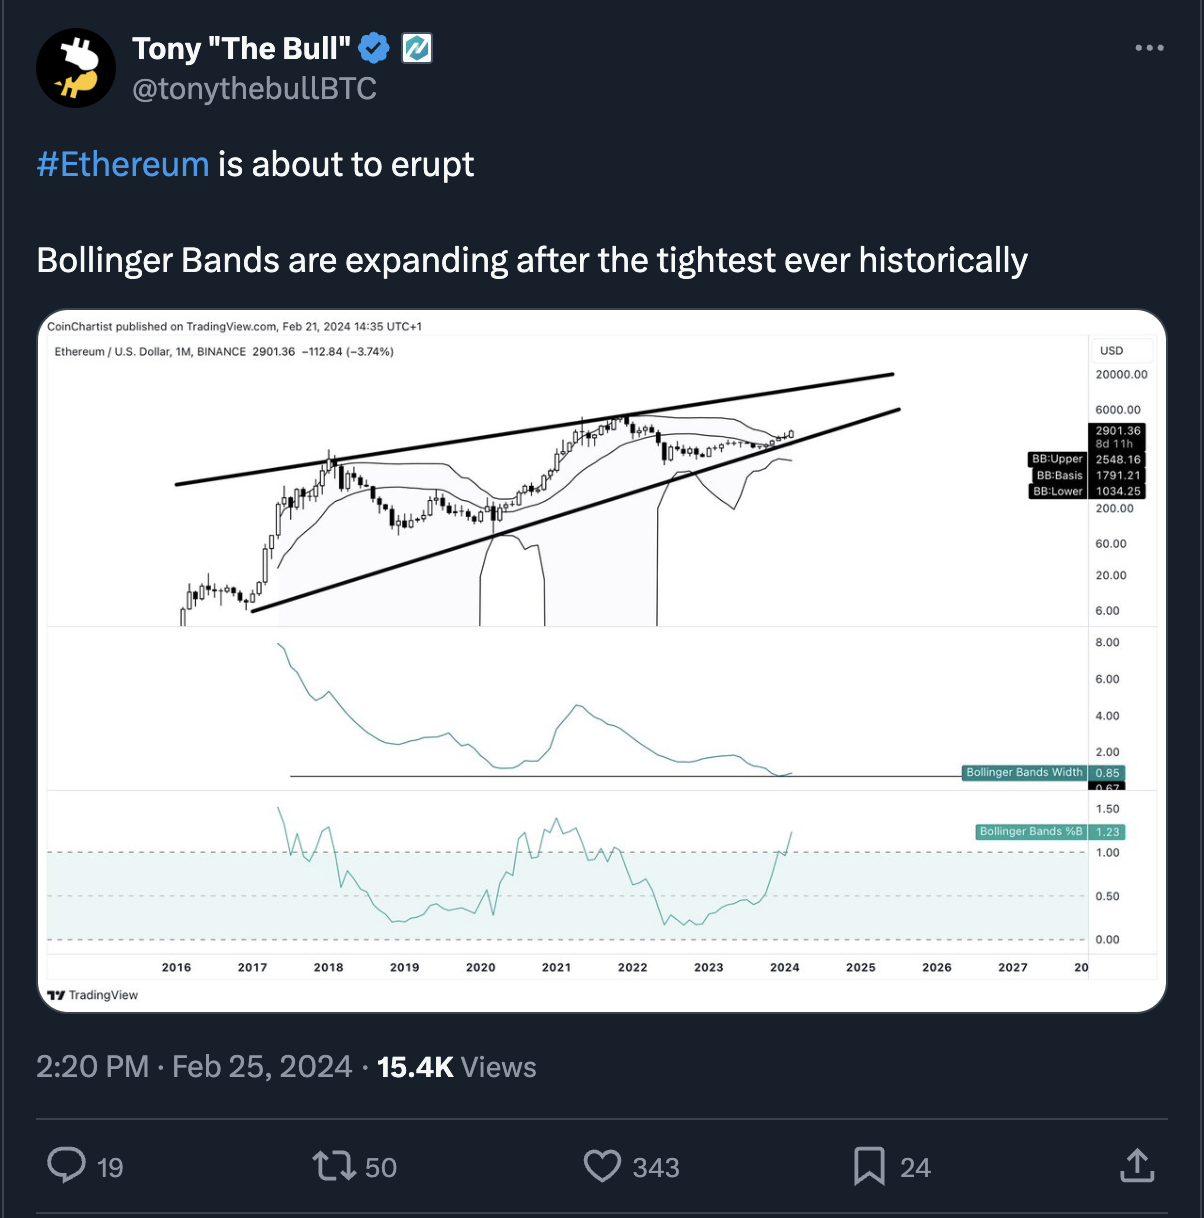
As history shows, these “squeezes” often precede key breakout levels (in either direction). Then, when the bands begin to expand, it typically signifies the start of a period of high volatility, generally in the direction of expansion (coinciding with a key breakout).
Despite the general optimism across the crypto markets, ETH prices have remained within a tight range in recent weeks. This trend is clearly observable in the monthly chart, which shows a period of price consolidation, leading to a 'squeeze' in the BB. Now, as the bands start to widen and monthly bullish bars band along the border of the upper band, it suggests the volatility surge with strong upward momentum.
In conclusion, and as an important disclaimer, I would like to quote once again from Kaleb Franzen’s post: “This study is unequivocally bullish, but we should view it simply as improving bullish probabilities rather than being outright bullish from a binary perspective.”
MetaTalks disclaims responsibility for any investment advice that may be contained in this article. All judgments expressed are solely the personal opinions of the author and the respondents. Any actions related to investing and trading in crypto markets involve the risk of losing funds. Based on the data provided, you make investment decisions in a balanced, responsible manner and at your own risk.